
Standard Deviation and Variance
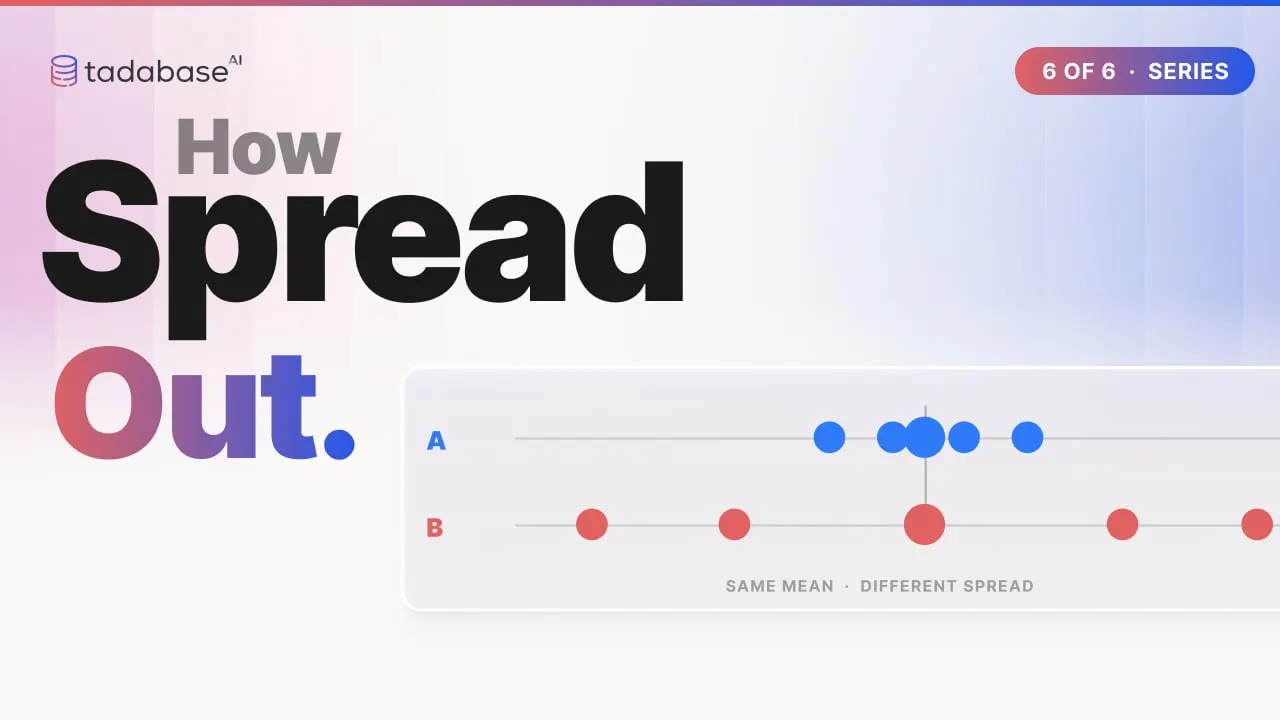
Two coffee shops both average a five-minute wait, but one is far more reliable. Standard deviation is the number that tells them apart. Here it is drawn step by step, then built in a Tadabase Rollup field.
On this page
In this video
- The idea: same average, different spread
- Standard deviation as the typical distance from the average
- Variance, drawn as squares
- One spread per group in a data table
- Population or sample: which one to pick
- How to set it up in the AI Builder, and the 3 rules to keep track of
Chapters
Read the docs
- Summarize connected records with a Rollup field Count connected records, or total, average, find the lowest or highest of, or list a field across them, with optional conditions.
- Window Functions Complete Guide Window Functions are powerful analytical tools that allow you to perform calculations across rows that are related to the current row. Unlike regular…
Transcript
Show the full transcript
0:00 Standard deviation and variance
Let's look at standard deviation and variance. An average tells you where the middle is. These tell you how far the numbers usually stray from it.
0:12 The idea: two coffee shops
Take two coffee shops, and time five orders at each. At Shop A you wait four, five or six minutes. At Shop B, anywhere from one minute to nine. Both shops average five minutes. The average cannot tell them apart.
0:29 Distance from the average
So measure how far each wait lands from the average. At Shop A, never more than one minute. At Shop B, up to four. Standard deviation is the typical distance from the average. About one minute at Shop A. About three at Shop B. Small number, reliable. Big number, unpredictable.
0:50 Variance, drawn as squares
Variance is the step in between. Square each distance at Shop B. Four becomes sixteen, three becomes nine. Average those squares, and you get ten. That is the variance. The side of that average square, about three point two minutes, is the standard deviation. For reports, use standard deviation. It is in minutes, just like your data.
1:15 In a data table
In a data table, here are the ten orders with a shop on each row. Group the calculation by shop, and every Shop A row gets Shop A's spread, and every Shop B row gets Shop B's. Zero point eight nine for A. Three point one six for B.
1:34 Where it helps
Where does this help? Which carrier delivers on a reliable schedule. Which sales rep closes consistent deal sizes. Which batch keeps its weight steady.
1:45 Population or sample?
Each one comes in two flavours. Population means your table holds every value there is. Divide by the count. Sample means your rows are a sample of something bigger, like a survey. Divide by one less. The sample number comes out slightly bigger. If your table holds all the records, use population.
2:05 Setting it up
Setting one up takes a few choices. Add a Rollup field on the table itself. Turn on Show All Tables, and pick this same table. Choose one of the four: population or sample, standard deviation or variance. Pick the number to measure. Pick an Order By field. It is required, even though the answer does not depend on it. And group it, to get one spread per shop. Save, and every order shows its shop's spread. Three rules to keep track of. Rule one: it measures the whole group. This is not a running figure. Every row in the group shows the group's spread.
2:42 Rule 2: sample needs two rows
Rule two: sample needs at least two rows. Shop C has a single order. Population gives it a spread of zero. Sample has nothing to compare it with, so it stays empty. That blank is correct. Rule three: Order By is required, but the direction does not matter. Ascending, or descending, the spread is the same.
3:05 Recap
That is standard deviation and variance. The average says where the middle is. The standard deviation says how far things usually stray from it. That wraps up the series on Rollup fields. Learn more at tadabase.com.
Also on Vimeo · the whole series on Vimeo