
Track record changes and deleted records
Review logged record changes, deleted records and record save timings for all your tables on the Records tab of Settings, Logs.
- Verified Nov 17, 2026
- Classic builder
On this page
Record logs record each change to a record and each deleted record, with when it happened, where it came from and the IP address. Settings > Logs > Records lists them for all your tables in one place, so you can audit who changed what without opening each table.
Turn on logging for a table #
Nothing is logged until you turn logging on for a table. In the Data Builder, open the table's Settings tab and, under Record Tracking, set Log Record Changes and Log Deleted Records to Yes. Only changes and deletes made after that are logged. Step-by-step: Track record changes and deleted records (Data Builder).
Open the record logs #
- Open Logs In the builder, click Settings, then Logs.
- Click Records Click the Records tab. It has sub-tabs for Change Logs, Debug Logs, Delete Logs and Batch Update Logs; you see the ones your plan includes.
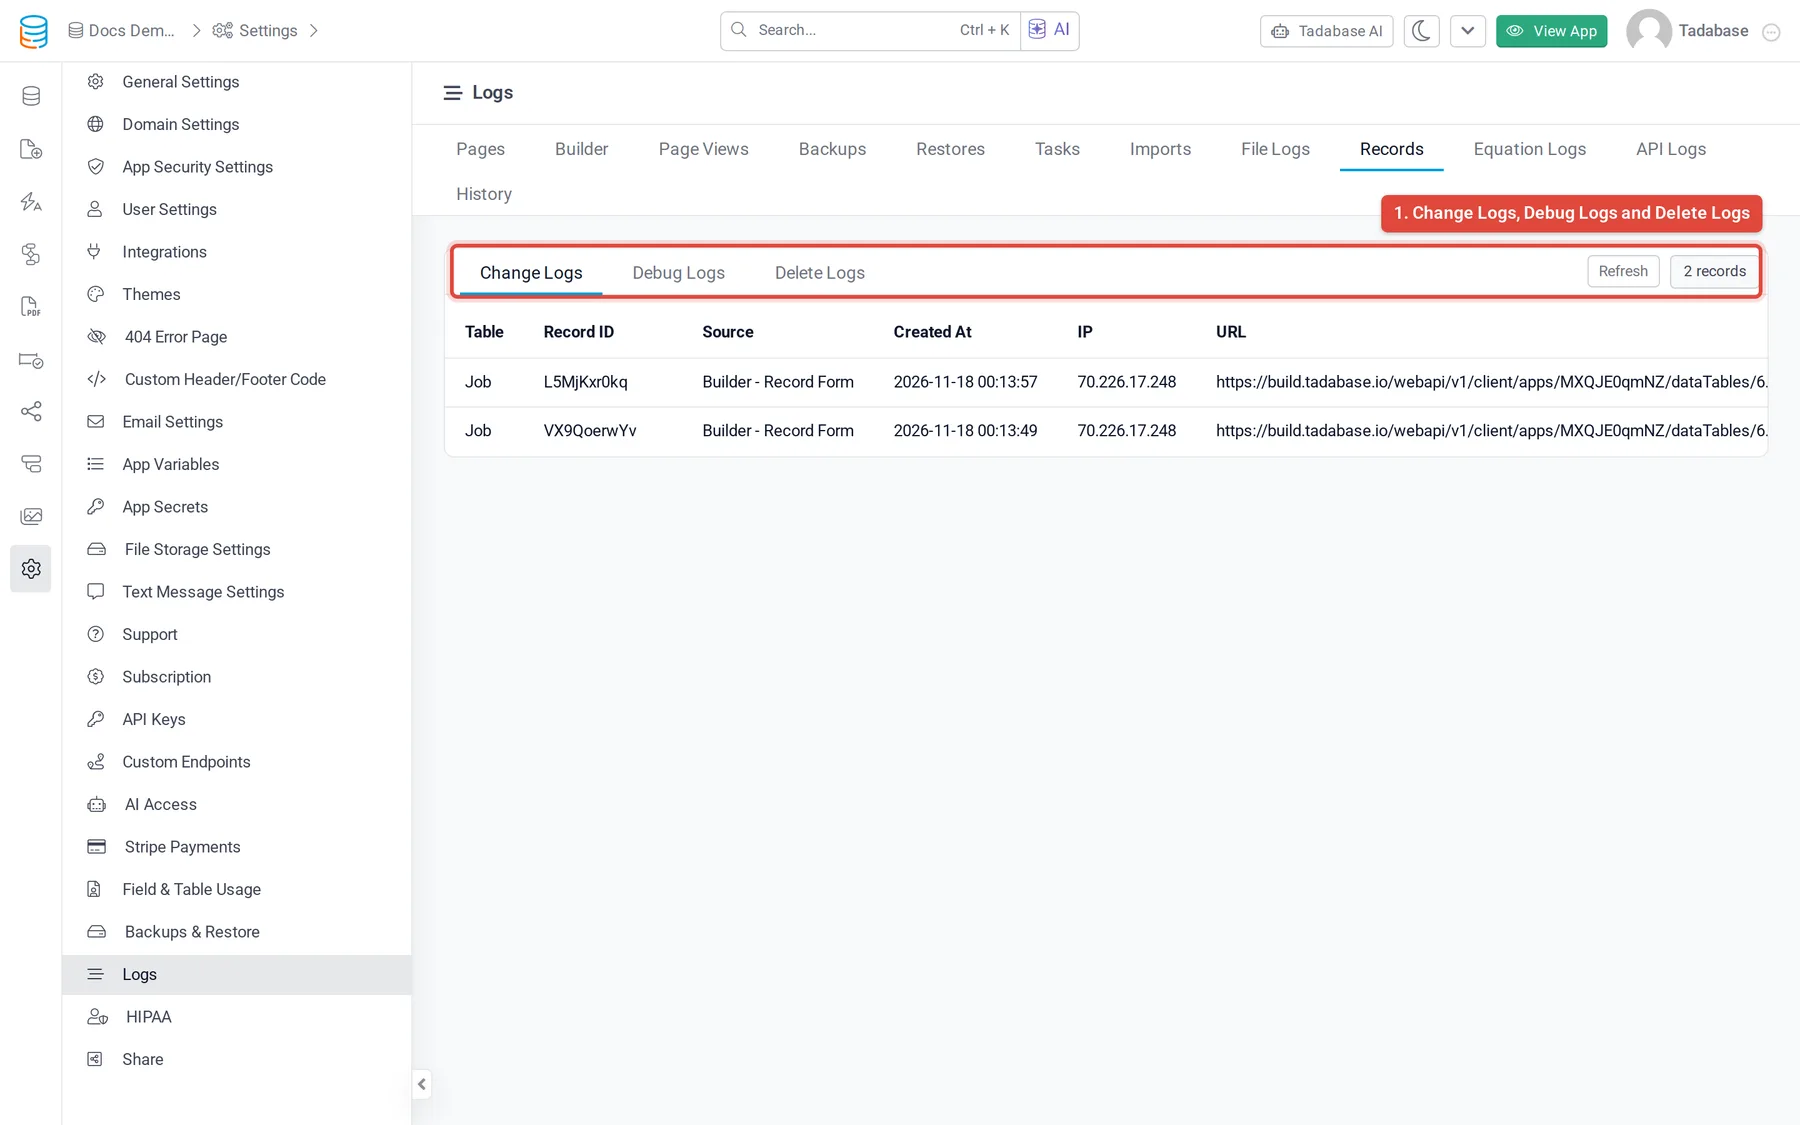
Change Logs #
One row for each logged change to a record, newest first.
| Column | What it shows |
|---|---|
| Table | The table the record belongs to. |
| Record ID | The record's ID. Click the pencil to open the record in the Data Builder. |
| Source | Where the change came from. |
| Created At | When the change was logged. |
| IP | The IP address the change came from. |
| URL | The address the change was made from. Hover to see all of it. |
To see the field values of each version of one record, open the record's history in the Data Builder (Record History on the table's Records tab).
Delete Logs #
One row for each record deleted from a table that has Log Deleted Records on, with the same columns as Change Logs: Table, Record ID, Source, Created At (when it was deleted), IP and URL. To see a deleted record's field values, open the table in the Data Builder and click the trash icon (Deleted Records Log).
Debug Logs #
Debug Logs time each step of a record save. They are recorded only while debug mode is on for your app, and Tadabase support turns debug mode on and off when they investigate a slow save; you cannot switch it on yourself. Outside those times the list stays empty.
| Column | What it shows |
|---|---|
| Table, Record ID | The record that was saved. |
| Start At, Complete At | When the save started and finished. |
| Total Time | How long the save took, in seconds. |
| Total Memory | Memory used by the save, in MB. |
| View | Opens the step-by-step timeline of the save. |
Debug mode is not available on apps protected under HIPAA.
Show record logs in your live app #
To let users see record logs on a page, add a Log Table component. See Adding logs to the app side. For the other logs in Settings, see Find your app's logs.
Was this page helpful?
Something wrong or missing on this page? Tell us.