
See how your tables connect
The Table Connection Graph draws every table in your app and the connection fields between them. Search it, focus on one table and download it.
- Verified Nov 17, 2026
- Classic builder
On this page
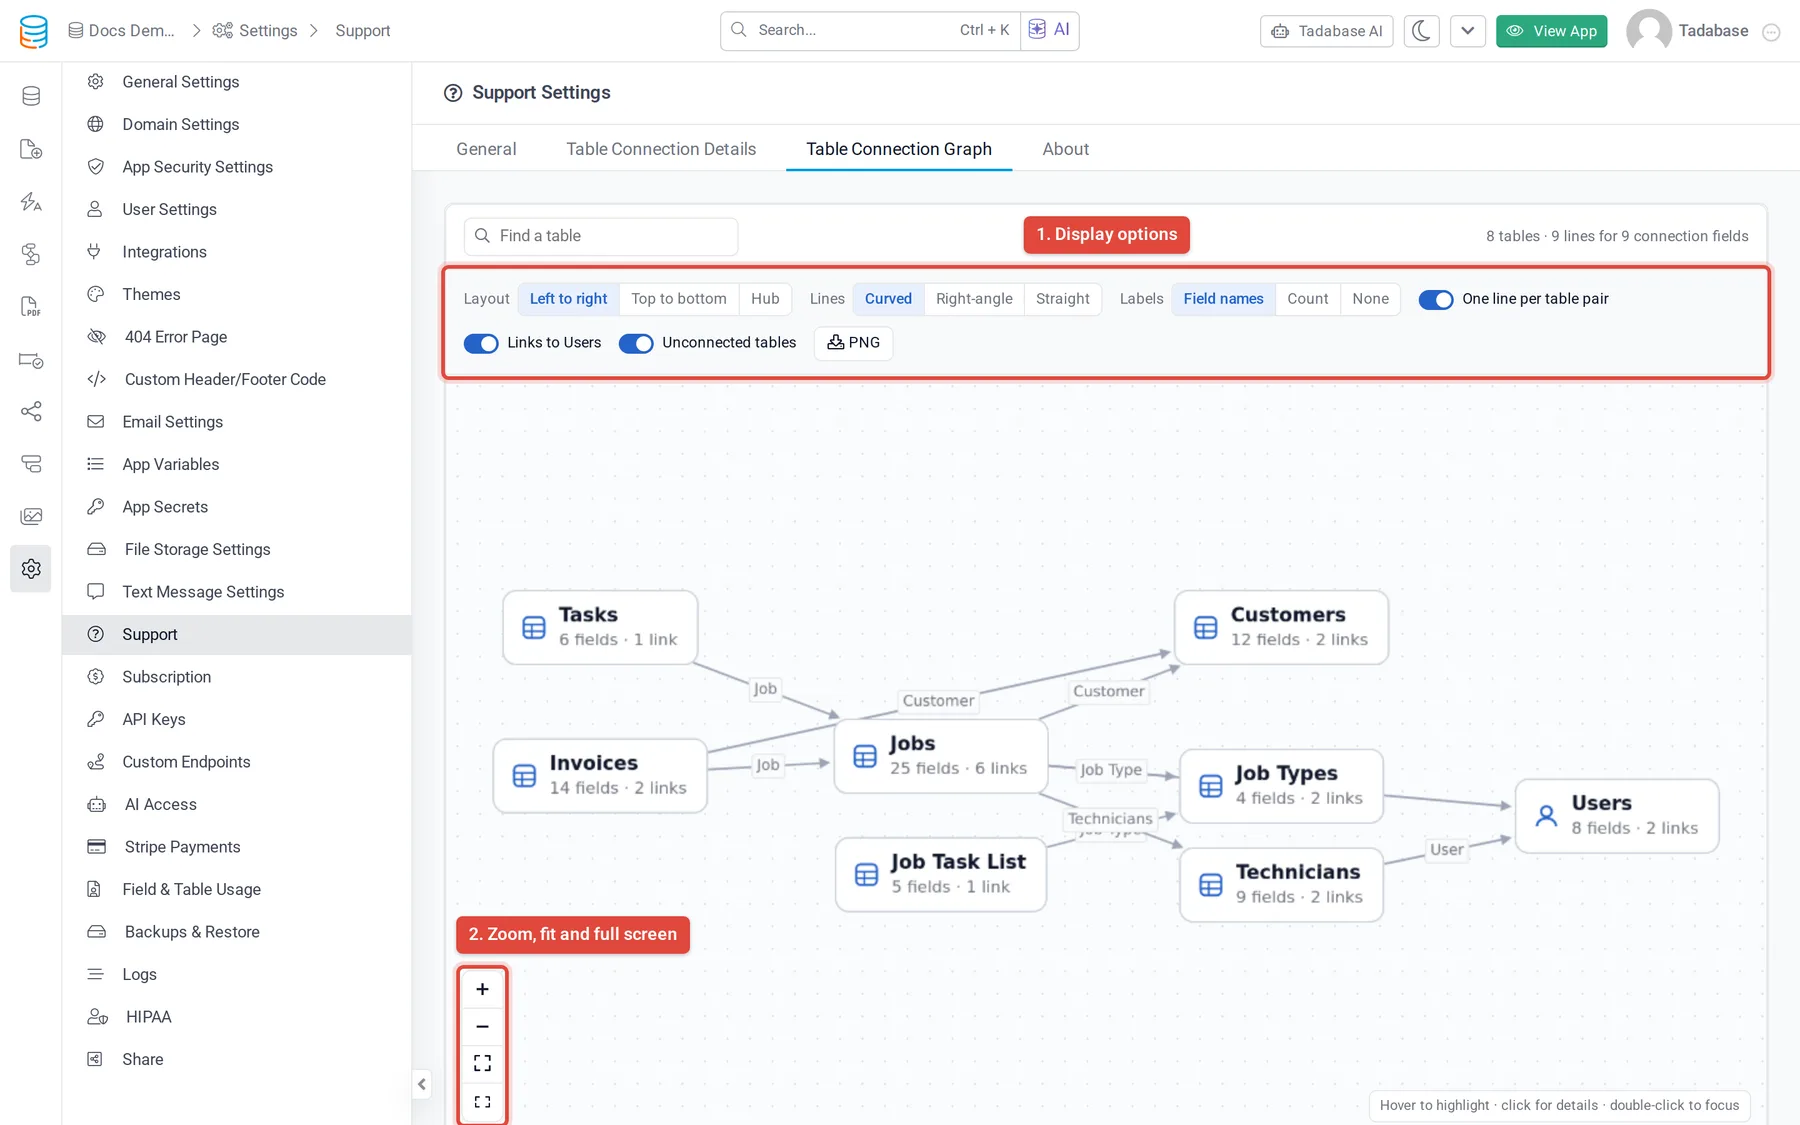
The Table Connection Graph draws your app's tables as cards and the connection fields between them as lines. Use it to see how your data fits together, find a table's links before you change it, or share a picture of your app's structure.
Open the graph #
- Open Support settings In the builder, open Settings and click Support.
- Choose the graph Click the Table Connection Graph tab.
To see one table and the tables linked to it, open the table in Data Builder and go to Connections, then Diagram, or click the Show Relation Graph icon on its Records tab.
Read the graph #
- Each card is a table, with its number of fields and of links.
- Each line is a connection between two tables, labelled with the connection field's name, or with the number of fields when two tables are linked by several.
- Hover over a card or line to highlight it. Click it to open a side panel with the details.
- Tables with no connection fields sit under Not connected below the graph.
The side panel of a table lists Connects to (the connection fields on this table), Connected from (the fields on other tables that point to it) and, if it has any, Links to itself. Click a table name in the panel to jump to it, or click Open table to open it in the Data Builder.
Focus on one table #
Double-click a table, or click Focus on this table in its panel, to show only that table and its links. Choose Direct links or 2 steps out to see the tables linked to it directly, or also the tables linked to those. Click Show all tables to go back.
Type in Find a table to highlight tables whose name matches.
Display options #
| Option | Choices |
|---|---|
| Layout | Left to right, Top to bottom, or Hub (the most-linked tables in the middle). |
| Lines | Curved, Right-angle or Straight. |
| Labels | Show Field names, a Count of fields, or None on the lines. |
| One line per table pair | Draw one line for all the connections between two tables instead of one per field. |
| Links to Users | Show or hide the connections to the Users table, which can crowd the graph. |
| Unconnected tables | Show or hide the Not connected list. |
| View | Only in big apps: Groups folds tables that link mostly to each other into one card per group; All tables draws every table. Double-click a group to open it. |
The buttons on the left zoom in and out, fit the graph to the screen and open it full screen. Click PNG to download the graph as an image. Your display choices are remembered in your browser.
Was this page helpful?
Something wrong or missing on this page? Tell us.