
Summarize data with a pivot table
Group records into rows and show counts, sums, averages, minimums or maximums in a Pivot Table, with totals, sorting, filter tabs and drill-down.
- Verified Nov 17, 2026
- Classic builder
On this page
A Pivot Table groups the records of a table by one or more fields and shows a calculated value for each group, such as the number of jobs per status or the total invoice amount per customer. People can click a row to see the records behind it.
How a pivot table is built #
| Part | What it is | Example |
|---|---|---|
| Rows | The fields records are grouped by. Each distinct value becomes a row. | Status |
| Columns | The values calculated for each row: a count of records, or the sum, average, minimum or maximum of a number field. | Total Number of records; Sum of Amount |
| Row Summaries | Extra columns that combine the values across each row. | Sum of the row's columns |
| Column Summaries | Extra rows at the bottom that combine the values down each column. | Grand total |
Add a Pivot Table #
- Add the component In the Page Builder, click Add Component in a column and choose Pivot Table under Data Components.
- Choose the records Under Which records should this pivot table display?, pick the table under Select data table, or records connected to the page's record or to the logged-in user. Click Customize.
- Add rows On the Pivot Table tab, under Rows, choose the Field to group by. Click Add Row to group by another field inside the first.
- Add columns Under Columns, choose Total Number of records or a number field and its calculation. Click Add Column for more.
- Add totals (optional) Click Add row Summary or Add Column Summary.
- Check the preview and save The preview on the right updates as you go. Click Update & Save.
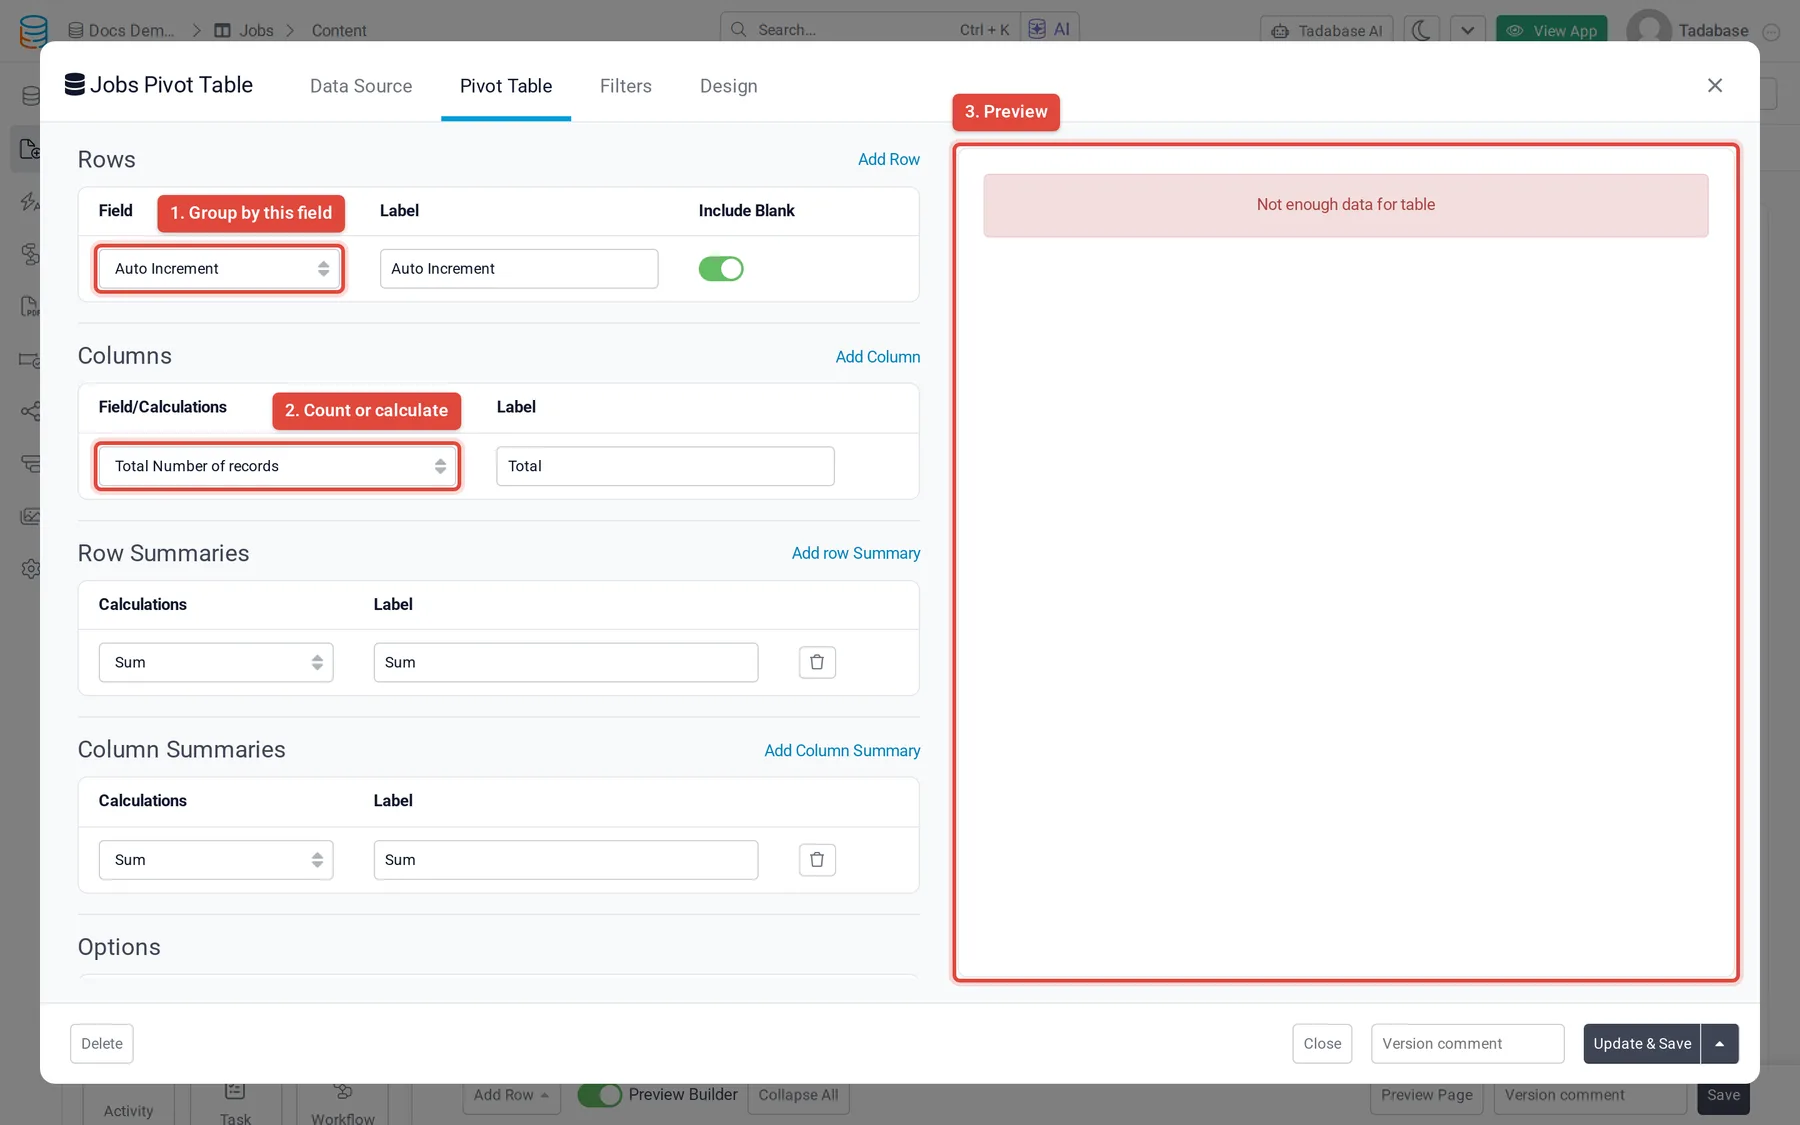
Rows #
| Setting | What it does |
|---|---|
| Field | The field to group by. |
| Label | The column heading for this field in the pivot table. |
| Include Blank | Show (default) adds a row for records where the field is empty; Hide leaves them out. |
You can group by Text, Text Formula, Number, Currency, Basic Formula, Complex Formula, Date, Time, Date/Time, Checkbox, Radio, Select, Decision Box, Rating and Slider fields, Equation fields that return a number, and one-to-one connection fields.
Columns and calculations #
| Setting | What it does |
|---|---|
| Field/ | Total Number of records counts the records in each row. Or pick a Number, Currency, Basic Formula, Complex Formula, Rating or Slider field, or an Equation that returns a number, and choose Sum, Average, Minimum or Maximum. |
| Label | The column heading. |
Row Summaries and Column Summaries each have a Calculations choice (Sum, Average, Minimum or Maximum) and a Label. A row summary adds a column that combines each row's column values; a column summary adds a row under the table that combines each column's values.
Title, sorting and drill-down #
Under Options on the Pivot Table tab:
| Option | What it does |
|---|---|
| Pivot Table Title | The heading shown above the table. |
| Sort By | Sort by any row field or column, ASC or DESC. Add New Sort adds a second sort for ties. |
| Side Panel View | Show opens a panel listing the records behind a row when someone clicks it. Load More in the panel loads more records. Side Panel Size: Small, Medium (default), Wide or Extra Wide. |
| Popup View | With the side panel on: Show lets people click a record in the panel to open it in a popup. |
Turning these on adds a Side Panel View tab and a Popup View tab, where you lay out the fields shown for each record, in rows and columns like a Details component.
Filter the records #
- To always leave records out, use Filters on the Data Source tab. See Filter the records a component shows.
- To let people switch between preset views, open the Filters tab, turn on Filter Tabs and click Add New Tab for each view. A Clear Filter tab is added unless you tick Hide Clear Filter Tab in the gear menu.
Common problems #
| What you see | What to do |
|---|---|
| A field is missing from the Field list under Rows or Columns | Its field type cannot be used there. See the lists above. |
| Totals look wrong | Check the calculation of each column: Average and Sum give very different results. Records with an empty group field form their own row unless Include Blank is Hide. |
| The live page shows a plan message | Your plan does not include the Pivot Table. |
Was this page helpful?
Something wrong or missing on this page? Tell us.