
Show your data as a chart
Add a pie, bar, line or area chart that groups your records by a field and shows a count or a total for each group.
- Verified Nov 17, 2026
- Classic builder
On this page
A Chart groups the records of a table by one field and draws a count or a total for each group, for example the number of jobs in each status. Use it on dashboards and reports.
Add a chart #
- Open the page In the Page Builder, open the page and its Content tab. Click the Components tab in the left panel.
- Add the Chart Under Data Components, click Chart or drag it into a column.
- Choose a chart type Under Choose a Chart Type, click Pie Chart, Bar Chart, Line Chart or Area Chart.
- Choose the records Answer Which records should this chart display? by selecting a table, or records connected to the page's record or to the logged-in user. See Choose which table and records a component shows.
- Set up the chart Click Customize. On the Chart tab, choose Group By and the calculation, as described below.
- Save Click Update & Close.
The settings window has four tabs: Data Source, Chart, Filters and Design.
Group the records and choose the values #
The Chart tab has a Data section and a calculation section.
| Setting | What it does |
|---|---|
| Group By | The field whose values become the slices, bars or points, for example Status. Each distinct value is one group. A connection field groups by the connected record. |
| Group Label | The name of the grouping shown on the chart, for example Status. |
| By | What each group measures. Total Number of records counts the records in the group. Picking a Number, Currency, Rating, Slider, Basic Formula, Complex Formula or Equation field adds up that field for the group (rounded to two decimals). |
| Label | The name of the value, shown in the legend and tooltips. It is Total for a new chart. |
Bar, line and area charts can show more than one value per group. Each value is a tab above the calculation; click Add New to add one, for example the count of jobs and the total of their invoices side by side. A pie chart has one value.
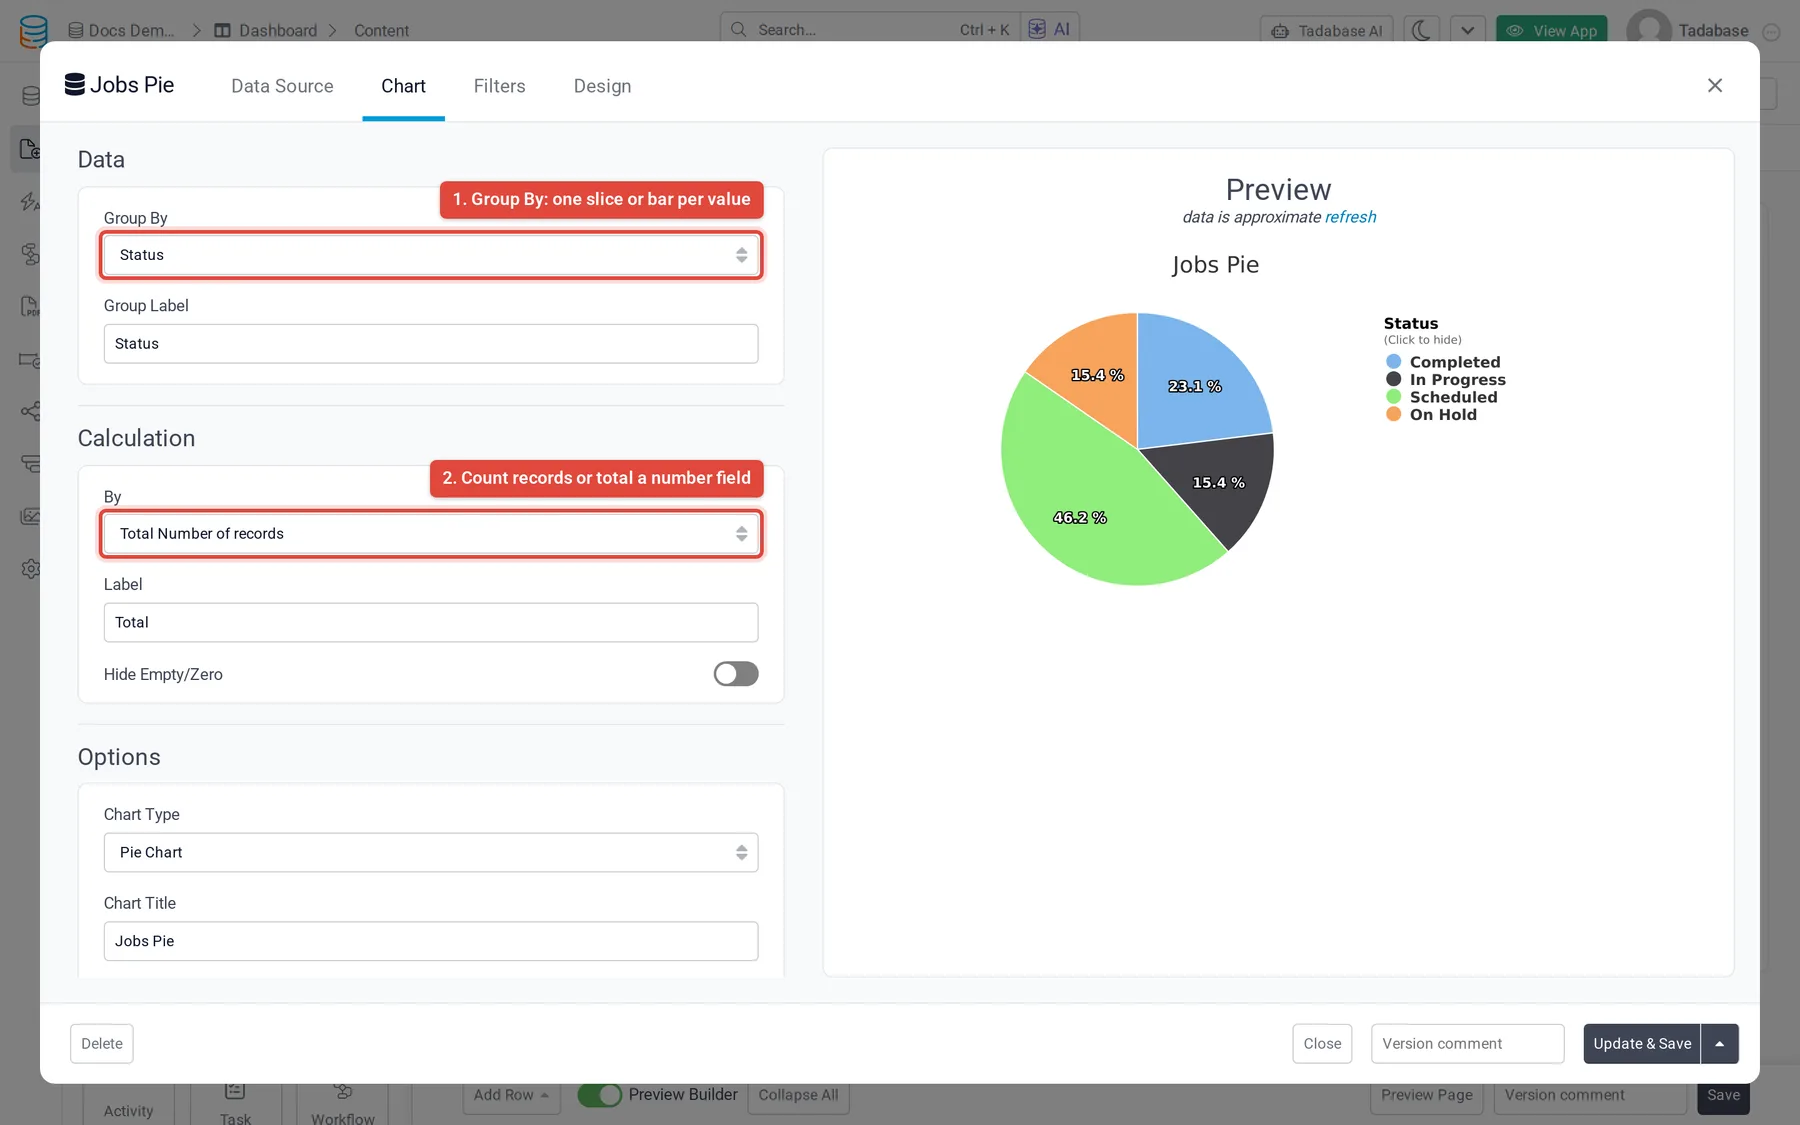
Chart options #
The Options section of the Chart tab changes how the chart looks.
| Option | What it does |
|---|---|
| Chart Type | For a pie chart: Pie Chart, Donut Chart or Semi-Circle Chart. For a bar chart: Bar Chart (horizontal bars) or Column (vertical bars). |
| Stacked | Bar charts only. Stacks the values of a group in one bar instead of side by side. |
| Chart Title | A title shown on the chart. |
| Sort By | Orders the groups by the Group By field or by the value, ascending or descending. |
| Legend | Where the legend appears: Right, Bottom or None. |
| Between Line | Line charts only. Hide removes the line that joins the points, leaving only the points. |
| Dimension | Auto fits the chart to its column. Custom lets you set Chart Width, Chart Height and Legend Width in pixels (a new chart starts at 500 by 350). |
| Theme | The color set: Default, Google, Soft, Bright, Gradient or Custom. |
Limit which records are charted #
- Data Source > Filters: click Add New Filter Group to chart only some records, for example jobs created this year. See Choose which records a component shows.
- Filters: turn on Filter Tabs to show tabs above the chart, each with its own conditions, so people can switch between views such as This Month and Last Month. Hide Clear Filter Tab removes the tab that clears the filter.
Design and PDF pages #
The Design tab sets the component's fonts, background, border, spacing and CSS. See Change how your app looks.
Chart is also listed under Data Components in the PDF Page editor, so a chart can be part of a generated PDF. There it has no Filters tab. See PDF pages.
Check that it works #
Open the page in your live app. Each group shows its count or total. If the chart is empty, check the data source filters, the selected filter tab, and that the Group By field has values.
Was this page helpful?
Something wrong or missing on this page? Tell us.